#SOTD 34: Three comic-strip style slides to illustrate a transition
March 31, 2022 2023-01-04 18:57#SOTD 34: Three comic-strip style slides to illustrate a transition
#SOTD 34: Three comic-strip style slides to illustrate a transition
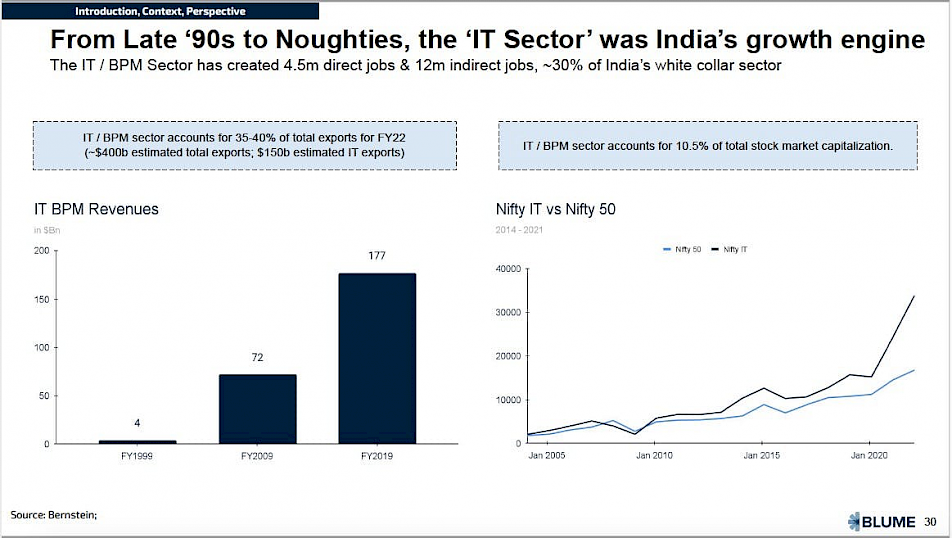
From almost nothing in 1990, the Indian IT+BPM sector’s estimated contribution to India’s exports is now a whopping 35-40%. The IT sector has been a key engine of growth for the Indian economy over the last 30 years.
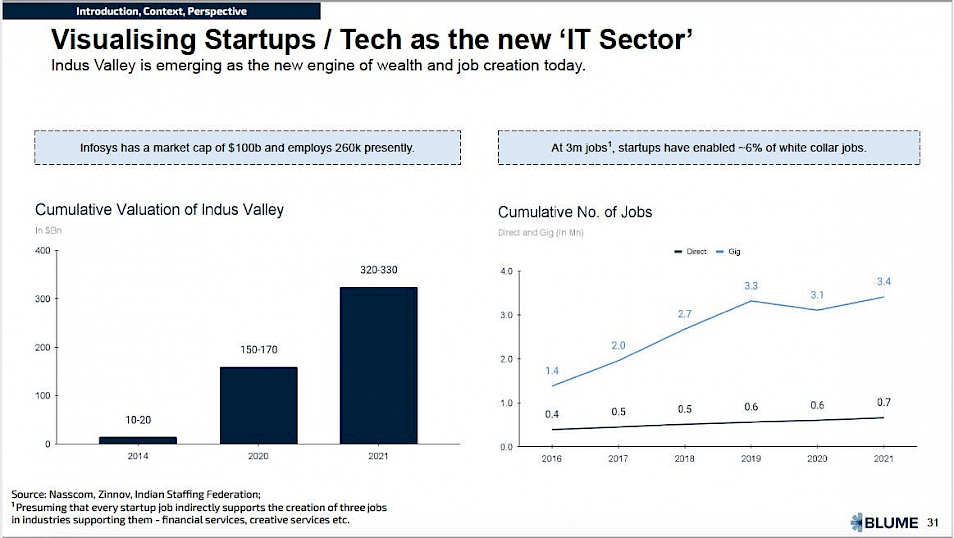
Guess which sector is taking over that mantle now.
In three simple, data-driven slides, the Indus Valley Annual Report lays out its argument:

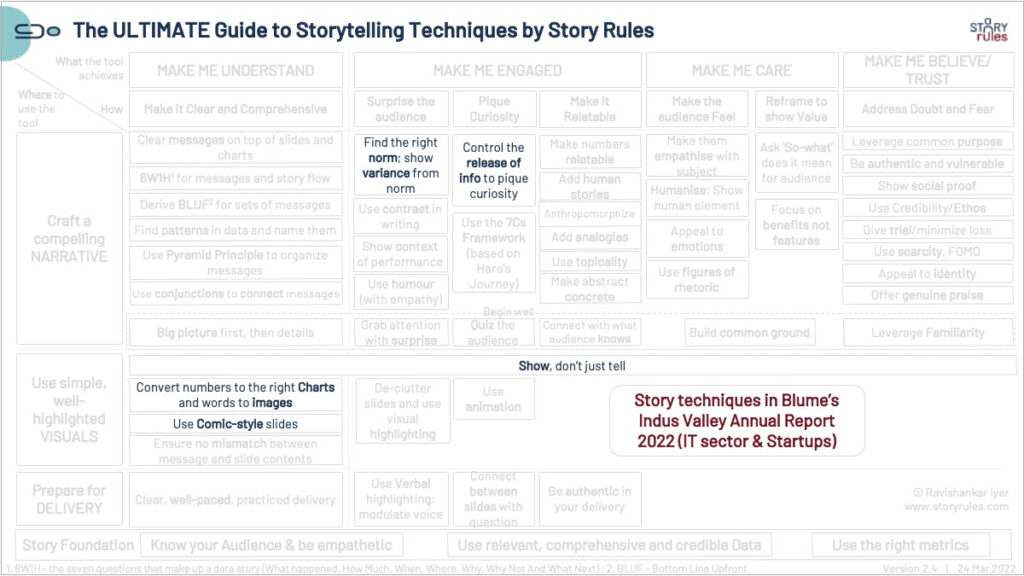
Note the data storytelling techniques used in the three slides above:
- All have a clear summarising message above (the addition of a secondary or subordinate message is also a good technique)
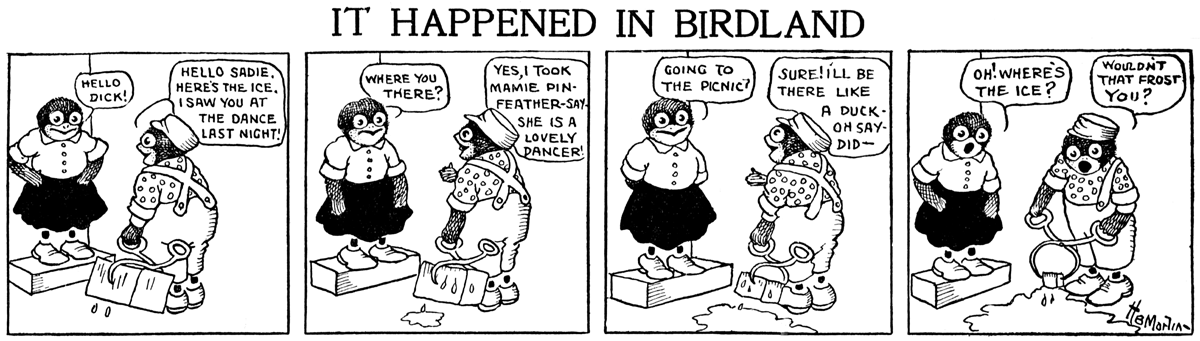
- Each of them feature the ‘comic-strip’ style slide design method. I’d earlier written about it here, when analysing a twitter thread. The above example is more relevant, since it features actual slides.
- Each slide is divided into 2 panels
- In each ‘panel’ the message sits on top with the (simple) visual below
- The narrative ‘flows’ between the panels and slide
The overall effect: The messages come out clearly for the audience to understand.
#SOTD 34