5 Data Story Lessons and 1 missing element from the Indus Valley Annual Report
Finding good data-story examples isn’t easy (unlike say ads). Luckily we have BlumeVentures‘ Indus Valley Annual Report 2024. In this let’s look at the 5 most impactful data-story techniques they’ve used in the report. And one aspect that they could have added.
Every year the good folks at Blume (this year it’s sajithpai, anurag_pagaria, and llnachull) put together a detailed narrative about India’s startup sector. The 132-pg 2024 report offers some fascinating insights into the Indian economy and its startup space.
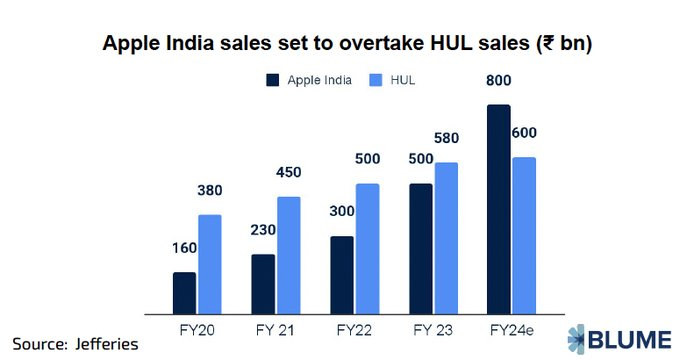
Did you know, for instance, that Apple India’s sales would soon be overtaking that of Hindustan Unilever?!
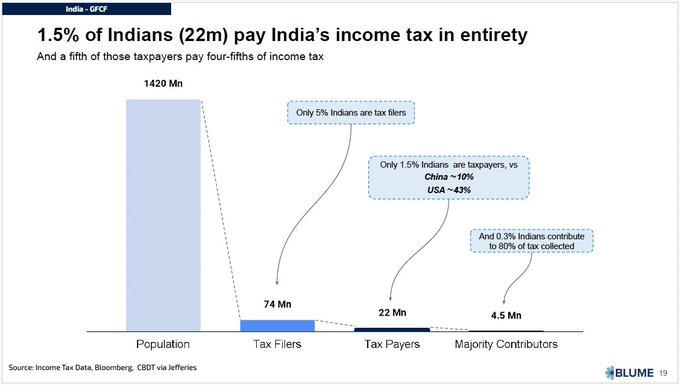
Or that 0.3% Indians (4.5M) contribute to 80% of income tax collected?
Apart from the insights, the deck is also a masterclass in clear data-storytelling. We’re lucky to be living in a time when such high-quality work is available for free consumption! Here are 5 data-story lessons I could glean from the report (and 1 missing element).
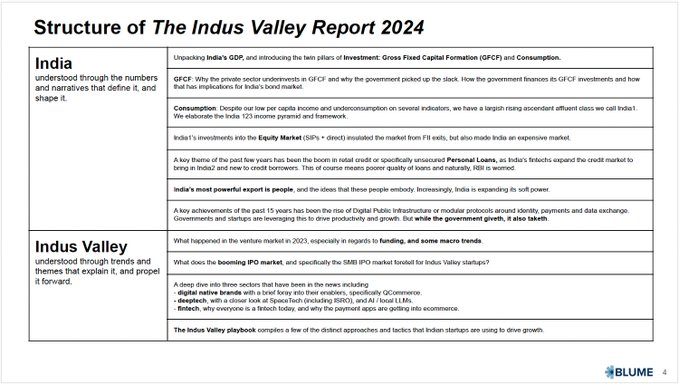
But, the report had one flaw for me. It missed having an Executive Summary. Sure, there was this ‘Structure’ slide. But this is more a Table of Contents. It does not tell you the entire narrative on one slide.
So I decided to attempt one. Using the 1-3-9 Story Spine
https://www.storyrules.com/a-story-structuring-framework-as-easy-as-1-3-9/
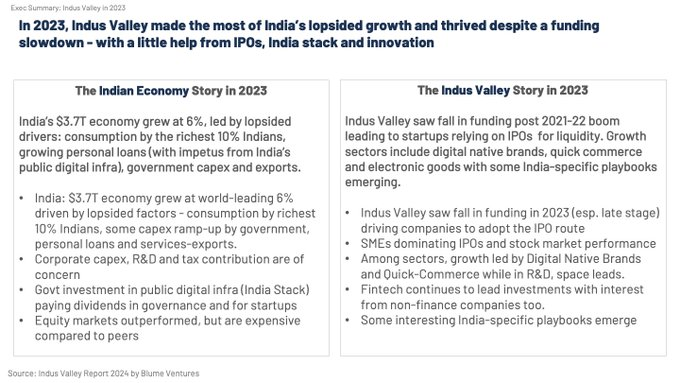
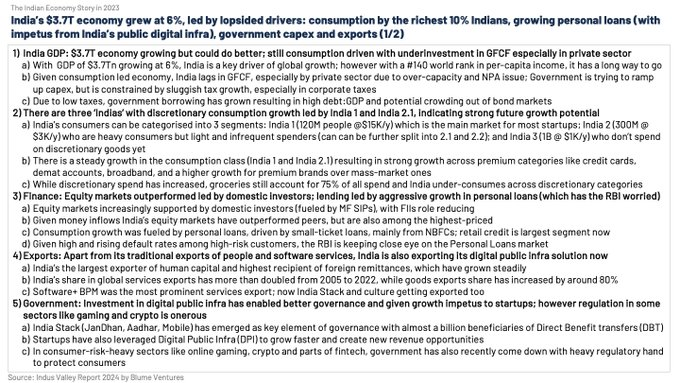
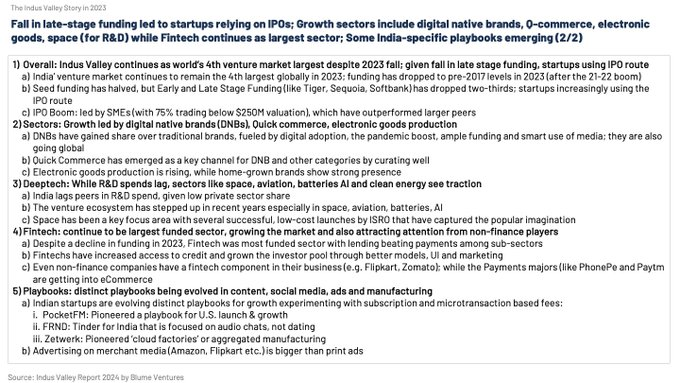
Here’s my 1-slide Executive Summary for the Indus Valley Report 2024…
And now for a more detailed (and text-heavy) 2-slide Executive Summary. (Read this on your laptop, not your phone)
3 advantages of having such a summary section in your PPT:
1. The reader can recap all key points at the end of a long deck
2. You can unearth better patterns (when taking a big-pic view of the whole story)
3. You can find missing elements or breaks in the story flow
To sum up:
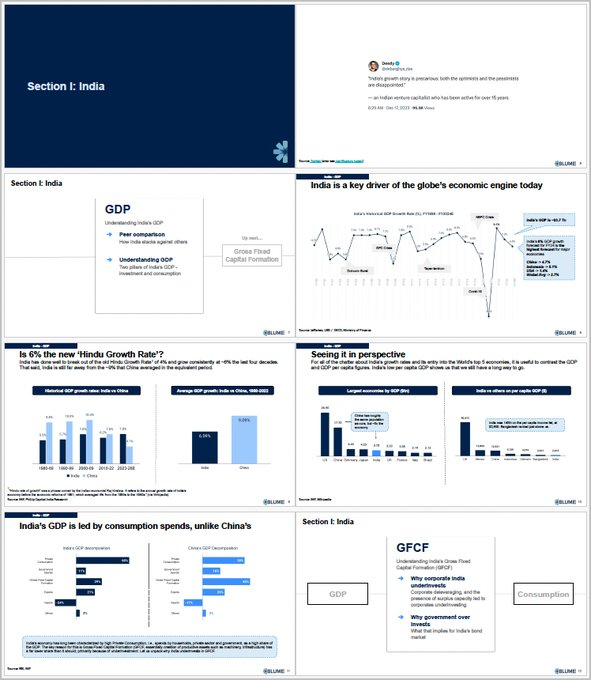
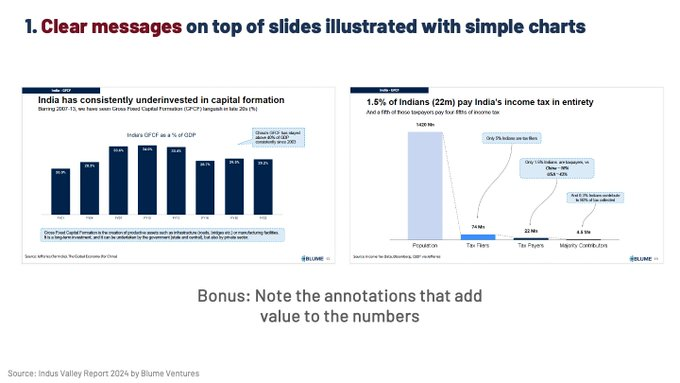
1. Have clear messages on top of slides
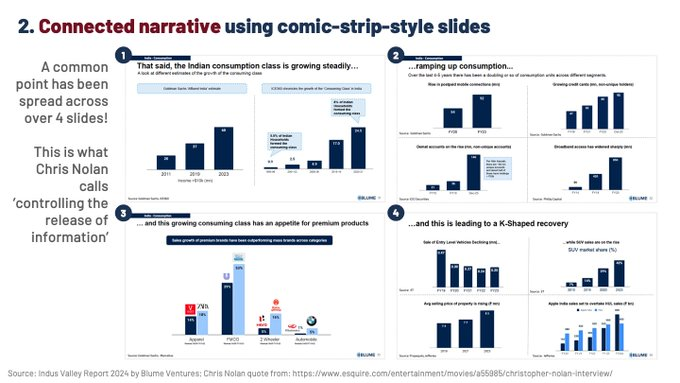
2. Connect the narrative using comic-style slides
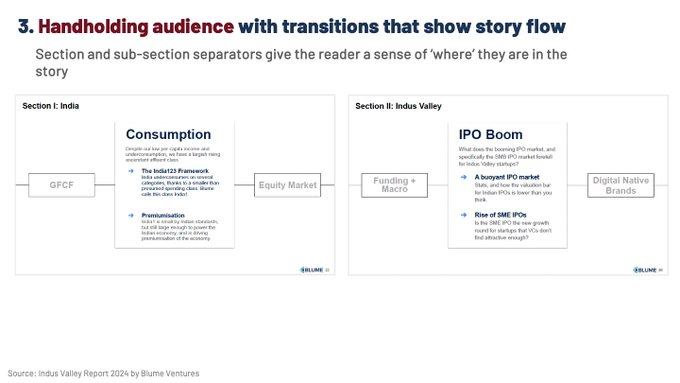
3. Handhold the audience with transitions
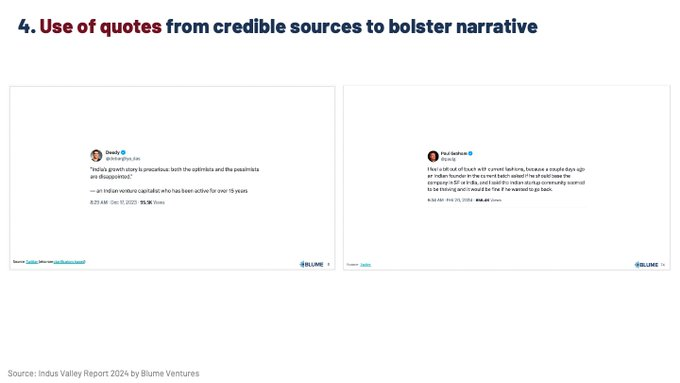
4. Use quotes from credible sources
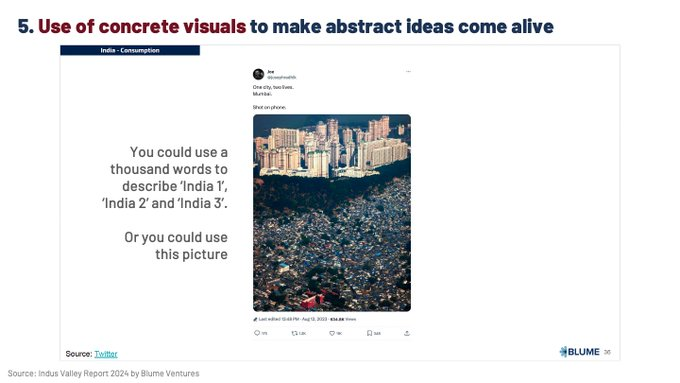
5. Use concrete visuals
And: Use the 1-3-9 Story Spine to craft your overall narrative
Finally: Read the insight-filled Indus Valley Annual Report 2024!
https://docsend.com/view/zqgfupfzyud499hn
Photo by Mei-Ling Mirow on Unsplash