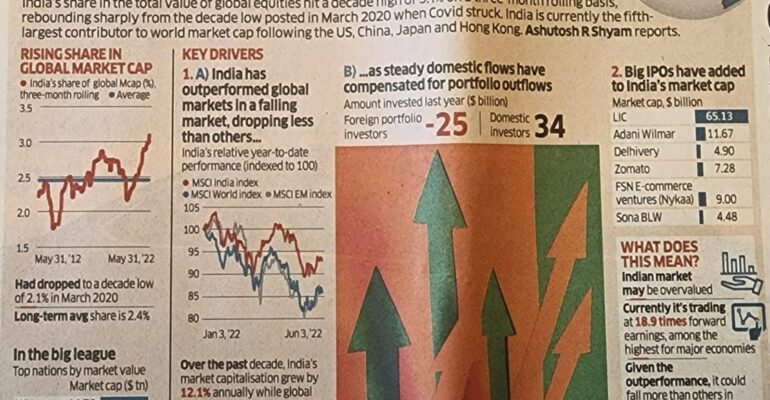
I was recently at a client office when my eyes fell on the Economic Times paper. An info-graphic on the front page caught my attention.
I smiled. “That’ll make a nice #SOTD, I thought”
Here’s the story:
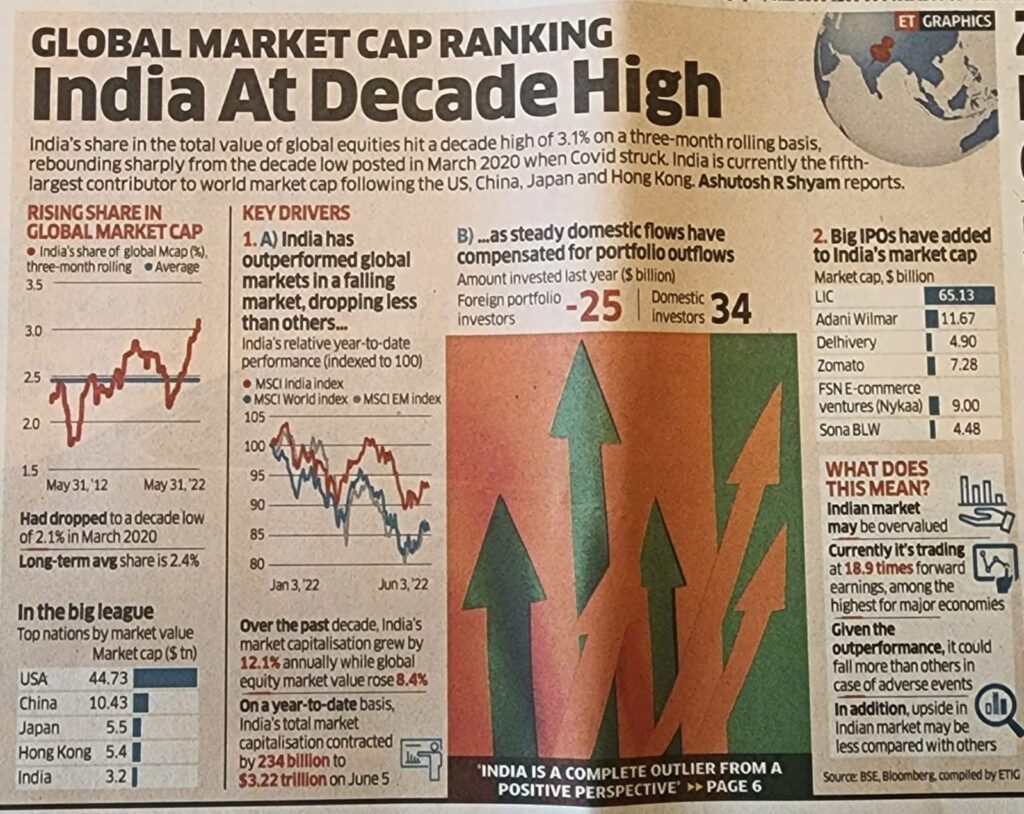
I noticed the following data-storytelling techniques used:
- Clear messages on the top – at the entire story level and also above each graph
- The story uses a simple flow:
- What happened?
- Why has it happened? (some theories)
- What are the implications?
- The graphs are simple and easy to understand
- The story uses ellipsis (…) between messages to connect them
#SOTD 74