A data-storytelling insight from the Jyotirlinga story
(This week’s a short one – but hopefully, enjoyable nevertheless!)
Among the Hindu Gods trinity of Brahma (Creator), Vishnu (Preserver) and Shiva (Destroyer), devotees’ prayers are not distributed equally.
While there are scores of temples to Vishnu and Shiva, poor ol’ Brahma has to contend with just a handful, with the most prominent one being at Pushkar, Rajasthan. Clearly something major happened at a very early stage of Hinduism such that the entire diverse community (and future generations) eschewed building temples to this member of the Trinity with a fairly critical job description.
Why so? Predictably the answer is in the form of stories. While there are many stories as to why Brahma is not worshipped, my favourite one is about the Jyotirlinga.
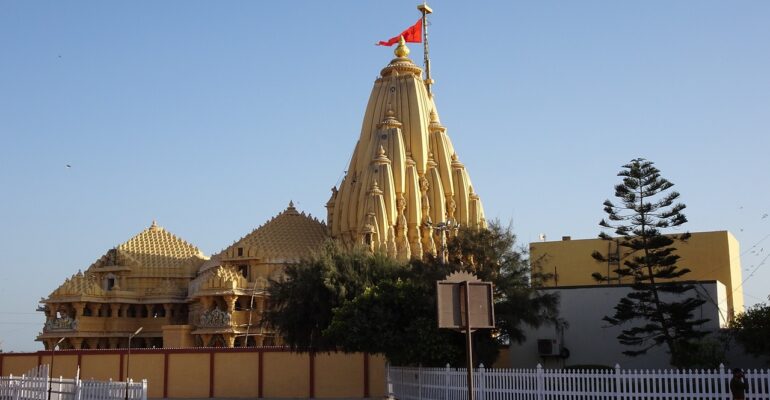
As per this story, once Brahma and Vishnu had an argument over the supremacy of creation. To settle the debate, Shiva pierced the three worlds appearing as a huge infinite pillar of light – the Jyotirlinga. The challenge for Brahma and Vishnu was to find the ends of this infinite pillar of light.
Vishnu assumed the form of a boar (Varaha-avatar experience) and dug into the earth to find the bottom of the Jyotirlinga; while Brahma took the form of a swan and flew up to find where it culminated.
When they both assembled back at the starting place, Vishnu admitted defeat – saying that he could not find the bottom. But (for reasons unknown) Brahma lied that he actually reached the end. (Naughty!)
Shiva (who is a super-cool dude, but sometimes has anger issues) did not take kindly to Brahma’s lie. You know what’s coming next – a curse.
So Shiva cursed Brahma that despite being the Creator of the universe, he would not be worshipped anywhere.
Fun story, but what’s the data-storytelling connection you may ask.
A good data storyteller should become the boar. And the swan
A data story is usually about some key business metric. Say, attrition.
When telling the story of that metric, you need to investigate two elements – the cause (Why) and the effect (So-what).
Think of the Jyotirlinga as a cause-effect continuum.
At whatever point you start, you need to figure out the ‘Why’. Why did attrition happen at the company level? Because it was high in Division A in the first quarter. Why was it high in Division A? Because there was an exodus of sales-people. Why did the sales-people leave? Because a new competitor had entered the market. Why did they all leave in Q1? Because they had just received their bonuses then.
To find the root cause, keep digging deeper by asking the ‘Whys’. Become the boar.
At whatever point you start, you also need to figure out the ‘So-What’. So what if attrition happened? We lost 3 accounts. So what if we lost them? They accounted for 10% of Division A’s sales. So what if they accounted for 10% of Division A’s sales? Division A is our largest unit and this impacted our quarterly revenue performance by 4% and profit by 7%. So what do we need to do about it? (You can now list down the remedial and preventive steps).
To find the effects (and further course of action), keep flying higher by asking the ‘So-whats’. Look for correlation – what will go up (positive correlation) or down (negative) with the key metric. Become the swan.
Don’t claim to have found the end of the Jyotirlinga though. Shiva won’t take kindly to it. 🙂
Image by Bishnu Sarangi from Pixabay


