How to measure the impact of storytelling training
Sanjay is the L&D Head at a leading data analytics firm. Business leaders at his company have a typical concern: their employees are great at working on various technical/analytics tools; but they struggle when it comes to telling the story of the insights (and the takeaways) that emerge from the analysis. Their slides end up being complex data-dumps and the audience struggles to understand what the presenter is trying to say.
Sanjay believes that this problem is addressable: data storytelling is a trainable skill and he is keen to organise a workshop on the same. But he has one concern: how to evaluate and measure the impact of such a program?
Before evaluating the impact of a storytelling training program, it is useful to figure out the objective of data-storytelling itself.
The Objective of Effective Storytelling with Data
Storytelling with data is the art of using insights and takeaways from data to persuade the audience of your point of view. When can you say that it was effective? Is it when the audience is ‘happy’ at the end of the presentation? Is it when they give you a ‘pat on the back’ for your work? No.
The gold standard of a successful data-story is when the audience takes a crucial step: acts on the recommendation/s at the end of your story.
What will make the audience act on the recommendations? They will, if they believe that they would benefit from implementing the same.
Why would the audience believe that? Only if they thoroughly understand the problem, your analysis and the proposed solution.
So an effective data-story must get your audience to:
- Understand: your facts, findings and analyses
- Believe: that your approach is right and they will benefit from your recommendations
- Act: on your recommendations
Conversely, if you dump data-heavy slides at your audience, then (even if you have done the right analysis and have the right recommendation), they may not act on it – because they didn’t clearly understand it in the first place.
So, now that we know what is the objective of data-storytelling, let’s look at the next question: how do you measure your employees’ improvement on this skill, post the training intervention?
Two challenges that affect measuring training impact
Evaluating training programs has always been tricky, given two challenges.
- The Isolation of Factors Issue: All training programs aim to make employees more productive; however there are so many factors that drive an employee’s performance, that it becomes difficult to isolate the impact of training.
- The Reinforcement challenge: Training is usually a one-time (sometimes with multiple touch-points) event; however, for entrenched habits to change, the employee needs to be driven by the right mix of incentives, guidance and reinforcement from seniors. Sometimes that may not happen
Despite these challenges, it is possible to evaluate the impact of data-storytelling training. And that’s because the outcome of the training is simple and clear – to enable employees tell more effective stories with data.
Measuring impact of training in storytelling
Employees in ‘knowledge jobs’ are persuading with data all the time – while writing emails, over informal conversations, during phone conversations… But there’s one category of work-events that has a disproportionate impact on productivity: high-stakes presentation situations.
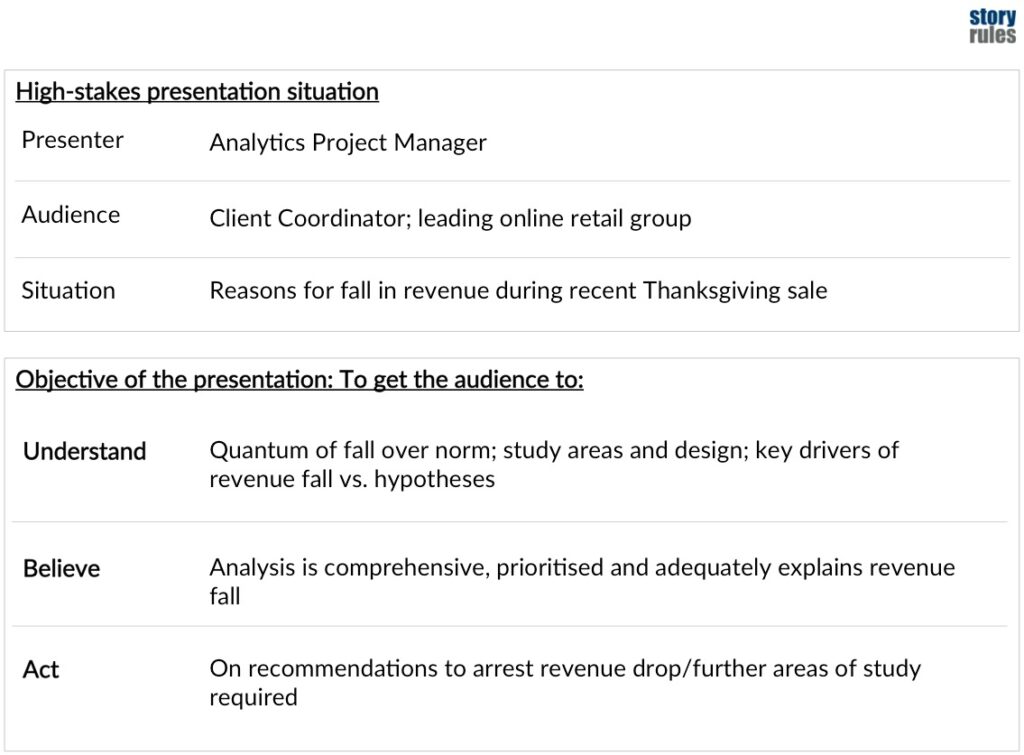
Some examples of such events are: a project deliverable report, a quarterly Board review, or a key investor pitch presentation. In each of these events, the presenter has a clear objective – which can be articulated in the form of what he or she wants the audience to understand, believe and act on. Let’s take the following example project:

To evaluate the impact of storytelling training, one needs to measure and track how employees are improving in achieving objectives such as the above. Here’s how you can do the same:
At the end of every high-stakes meeting, take a dipstick measurement from the audience members for how well it achieved the three goals – of understanding, belief and action.
1. Understanding: This can be measured by asking a simple question to the audience at the end of the presentation (or maybe the next day): On a scale of 1-10, how clear was the presentation in conveying the findings, insights and recommendations? And if you would like to measure performance in more detail, it could include the following sub-questions (along with the answers on a scale of 1-10):
- Was the presentation comprehensive?
- Was it in the right flow?
- Was it visually simple and clear?
- Was it delivered impactfully?
2. Belief: On a scale of 1-10, how much do you believe that the recommendations would help you achieve your objectives?
3. Action: This would be measured on actual action taken on the recommendations. Since there could be multiple suggestions and some may have been partly acted upon, the presenter could ask this question (say, after a couple of months) to the audience: On a scale of 1-10, what score would you give to the actions taken on the recommendations and the resultant impact?
Of course these scorecards could be made more detailed and nuanced, but it might be better to keep them simple and easy to implement. The idea would be to see how the scores are moving, for the same person or team, over time – so the business/L&D leader should maintain individual scorecards for each individual/team which delivers high-stakes presentations. Ideally there would be a general upward trend over time, till it stabilises at a desired high score.
Sanjay may not know how effective the proposed storytelling intervention would turn out to be; but at least now he has a tool to measure it.
*****
Featured Image credit: Photo by Dan Lohmar on Unsplash


