In a recent storytelling training program I came across an interesting case-study of a business unit leader called Ankit (name changed).
Ankit was excited to present his division’s quarterly performance numbers – given that they had delivered a whopping 4X YoY revenue growth. He was also sure of the reason driving the growth – the new dynamic pricing policy that they had adopted. He should know – after all, he was instrumental in implementing it.
On that count, however, he was utterly wrong.
We all do this
Once every quarter (or month) the leadership of every reasonably-sized company gathers for a time-honoured ritual: the review meeting. Which is, let’s face it, not the most anticipated day of the month for most of us.
We’ve all been there. Sitting through slide after slide of badly formatted tables, truckloads of text, the occasional (ill-chosen) chart or visual. The day seems unending, the coffee ineffective. The whole exercise seems like an inevitable punishment that everyone has to go through.
But it doesn’t have to be that way. Let’s get back to Ankit and his presentation.
A data-heavy set of slides
Ankit’s division was in the cargo movement business. Despite not introducing any new products, or tapping new geographies, the division had seen the 4X sales spike. He believed it to be driven by a better ‘dynamic’ pricing strategy (earlier, pricing was fixed and no attempt was made by the division to modify the same based on the demand-supply situation). Ankit’s team had changed that this quarter and were rightfully proud of the move. But was it the key factor impacting the sales growth?
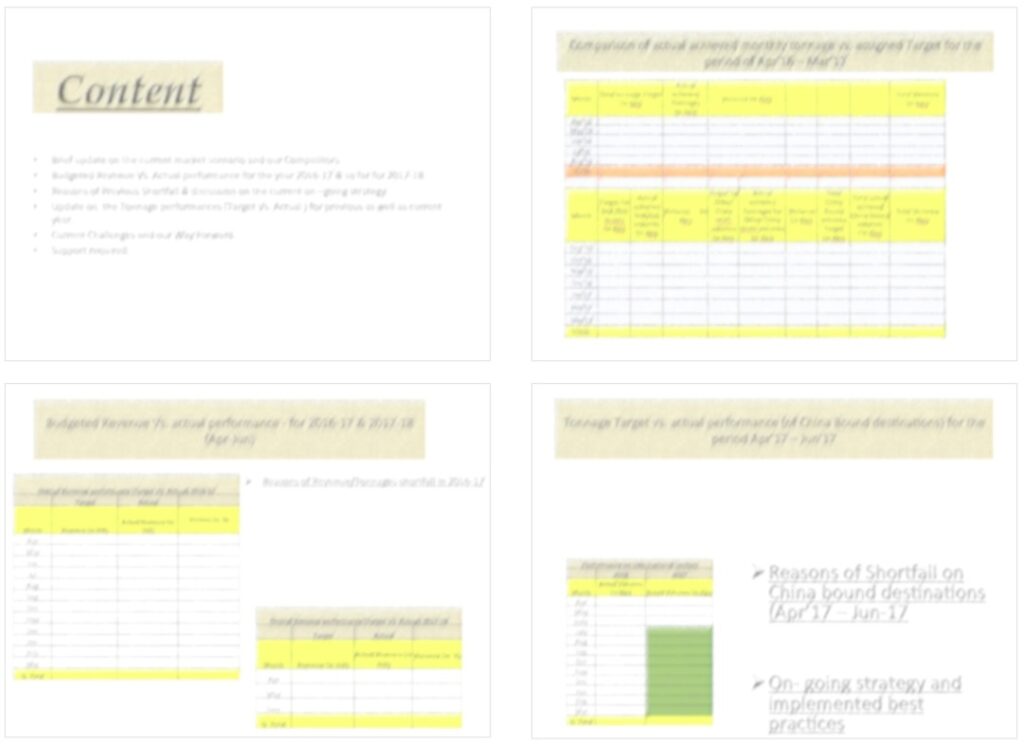
Before we look at the underlying data, let’s look at the slide formats used by Ankit to showcase the data (slides blurred to mask the words, but you get the sense):
Some of you may be able to relate with slides like this – data-heavy, lacking a clear set of messages and devoid of visuals. While the slides definitely need a signifiant repair job, before we do that, let’s find the story first.
Analysing the data underlying that 4X sales growth
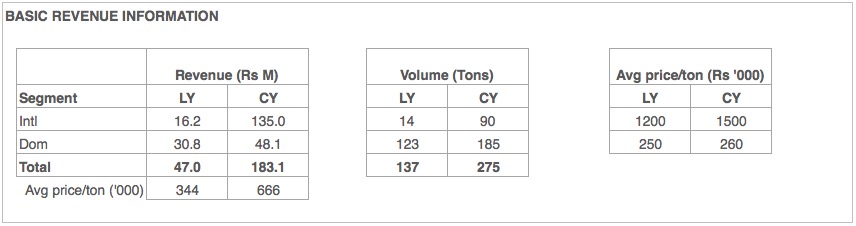
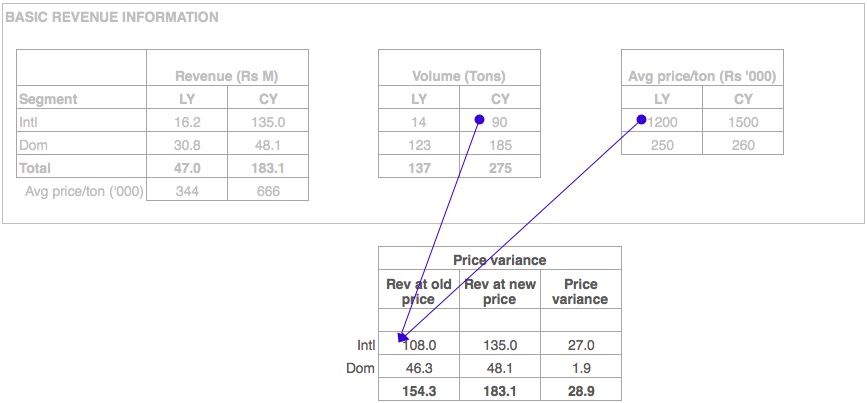
Here is the (masked) data underlying the sales growth: The cargo division’s last year Q1 revenue was Rs. 47 Mn, which has grown to Rs. 183 Mn in Q1 this year.
The first step in understanding the reason for the change always has to be the simple equation: Revenue = volume * price. Let’s look at the breakup of that revenue growth by volume and price, across the two main segments – International and Domestic.
Clearly you can see there’s growth on both the underlying factors: Volume and (weighted average) price. But how much has each factor contributed to the increase? When you start working on that, you realise a third angle comes into the mix: the mix.
The ‘mix’ refers to the change in the ratio of sales in each segment. This factor becomes especially important if the average price varies significantly across segments (as it is in this case). In this quarter, there seems to be a positive movement on mix too, with a higher proportion of high-value ‘International’ segment sales being made.
So, all three factors seem to have positively influenced the revenue growth? But which one was the most prominent? Is it pricing, as believed by Ankit? And can we exactly quantify the impact of each factor? Let’s find out.
Deconstructing the revenue increase using a cost-accounting tool: Variance analysis
When I was using first-principles to deconstruct the impact of the three factors, a thought hit me like a bolt of lightning: I was using an age-old cost-accounting technique called ‘Variance Analysis‘ (under ‘Standard Costing’), that I had learnt during my CA days!
For those who balk at anything to do with Accounting, fear not – this is a simpler, more intuitive part of accounting. Let’s dive into it, and you’ll see why.
Underlying variance analysis is the concept of isolation – the impact of each factor driving revenue is isolated, by keeping other factors the same as before. We need to isolate the effect of the following three factors on revenue:
Volume increase
Change in mix
Price increase
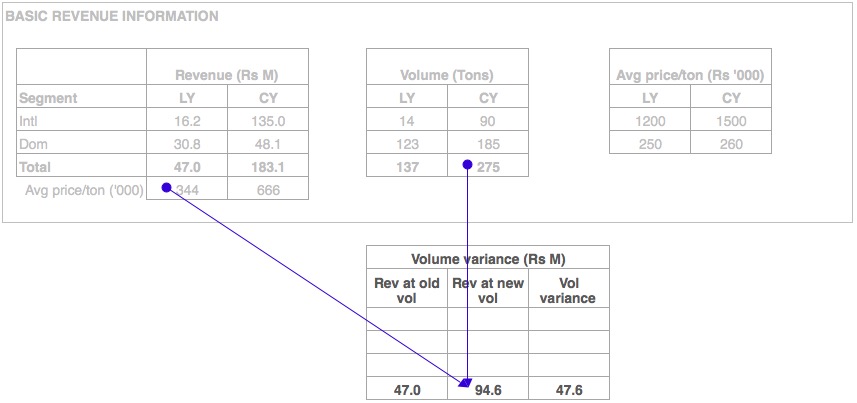
Let’s start with the first one – volume increase. Going by the principle of isolation, we will only look at how much has the total volume increased by (since any examination of the split of volume by segments would come under Mix variance).
You would see a volume variance of Rs. 47.6 M computed above. Let’s understand the two steps to arrive at the number:
(A) The revenue at the previous year’s total volume: Rs. 47.0 M
(B) The revenue that would’ve resulted if we had only changed total volume and nothing else (isolation). So we take the total volume figure of this year (275 tons) and multiply that by the weighted average realisation of last year (since we don’t want any mix or price factors vitiating this analysis): Rs. 94.6 M
Thus the volume variance is (B) minus (A): Rs. 47.6 M – in other words this is the ‘lift’ for the revenue purely because they moved more tonnage.
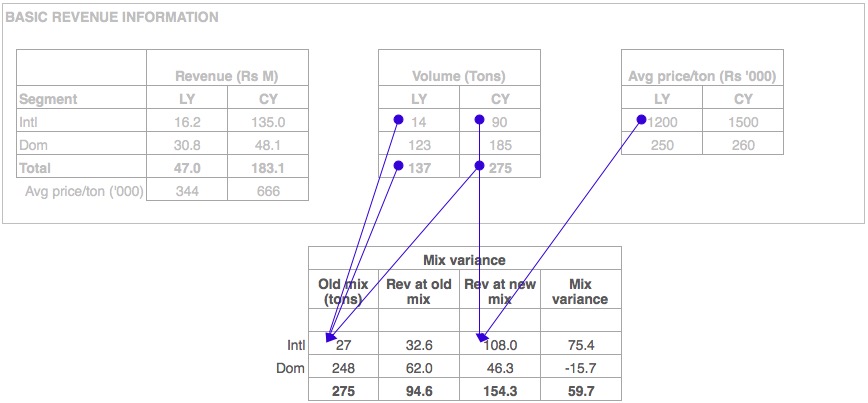
We now move onto the next one: Mix variance.
This is a bit more tricky – here’s how the mix variance is computed:
(A) Step 1 is to compute the new volume of 275 tons with the old mix (Why new volume? Since we’ve already accounted for the increase in overall tonnage from 137 to 275). So we split 275 in the old mix ratio (i.e. 14:123)
(B) Step 2 is to compute the revenue if we had sold all the 275 tons in the old mix. Here it is important to note that we still haven’t come to price increase – so we use the old prices (last year prices of 1200 and 250)
(C) We then compute the revenue under the new mix. Now we use the 275 tons in the new mix ratio (90:185) and again multiply it with the old prices (remember, price variance comes later)
And that’s how we get the mix variance (C minus B): Rs. 59.7 M
Finally we come to the price variance:
This one is straight-forward.
(A) First we compute the revenue with new volume, new mix but at old price (which comes to Rs. 154.3 M)
(B) Finally we come to the last step: the revenue with new volume, new mix and new price: Rs. 183.1 M
The price variance is Rs. 28.9 M
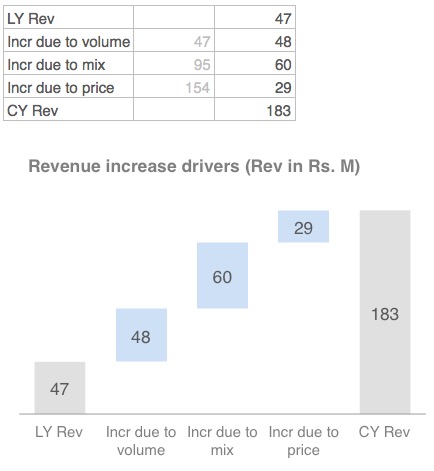
Visualising the impact of revenue growth drivers
Let’s put this on a chart – given that this is showing movement across two time periods, the water-fall chart works best.
There we have it – a simple visual that shows the most important driver of the revenue growth was not the dynamic pricing strategy, but actually the change in mix from domestic to international; followed by the increase in volume. A simple analysis that completely upended the key message from the original review presentation. Imagine the impact on decision making!
Transforming the Internal review meeting through better storytelling
While cost-accounting tool we used (Variance Analysis) may seem to have transformed the original presentation, we believe that it was the underlying science of storytelling, which asked the right questions which led to the usage of the tool in the first place.
If you would like a Chartered-Accountant-MBA-turned-storyteller to examine how you can improve your own internal review meetings, you know who to reach out to