
Three ideas for improving Indian government data by Pramit Bhattacharya

Welcome to Story Rules on Saturday – your weekly curated content recommendations to enhance your storytelling skills.
This week’s headline article is a plea to overhaul India’s statistical infrastructure, which showed gaping holes in the management of the pandemic.
But first up, the #SOTD Digest.
The #SOTD Digest
Here’s a quick summary of the five #SOTD emails from the past week:
– #SOTD 21: To put that in perspective: Ukraine’s area is 603,548 sq. miles. Or wait, was that sq. kms? The trouble is – we don’t really get big numbers.
How about if I say – Ukraine’s area is roughly equal to the states of Maharashtra and Madhya Pradesh put together? Much better?
The key is to make your big numbers relatable to your audience. A simple technique: Once you have shared the number, add a relatable comparison starting with the phrase “To put that in perspective…”.
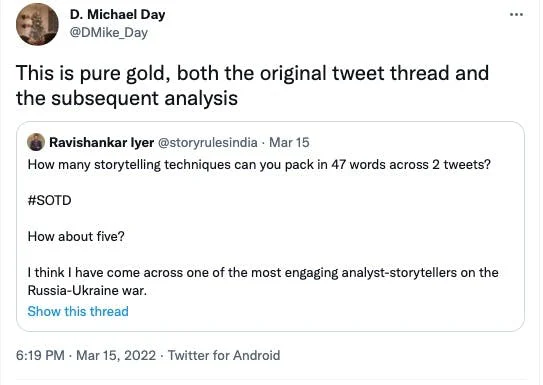
– #SOTD 22: Two tweets, five story lessons: I found an insightful tweet thread by Prof. Paul Poast (who teaches Pol-Science at the Univ of Chicago) on the Russia-Ukraine war.
In this post, I analyse five storytelling techniques he uses in just the first two tweets!
This was the most popular #SOTD of the week.
– #SOTD 25: Organising, labelling and mnemonic devices: What technique is common to – The 4Ps of Marketing, The SWOT framework, the CODE process by Tiago Forte or the SUCCESs model used in ‘Made to Stick’?- #SOTD 23: Three more tweets, one powerful lesson: In this second post, I look at what the humble comic-strip can teach us about data storytelling. Featuring a cool example from a real-life Accenture presentation and one example of a slide I made for a client.
– #SOTD 24: Connections: In this final post on Prof. Poast’s thread, I look at the connective tissue that holds messages together and improves the story flow: conjunctions!
The answer: smart, MECE mnemonic devices.
I analyse a tweet by Gaurav Singh where he uses one of these to break down the jobs of a CEO. He labels them the “5Ds”: Direction, Dollars, Diamonds, Decibels and Delivery!
Those were the #SOTDs of last week. In case you would like to get these daily emails in your inbox (9.30 AM, India time), here’s where you hop onboard:
Article of the week
a. Data lessons from two years of the covid-19 pandemic by Pramit Bhattacharya (Mint)
This paywalled article is a thoughtful analysis of the key gaps in India’s statistical infrastructure by one of the foremost experts on the topic. Pramit Bhattacharya (now a freelance columnist) was the Editor (Data) at Mint.
In the article, he discerns three lessons from how the Indian government managed data while handling the pandemic (all quotes from the article):
1. Create an open data ecosystem
India was among the laggards in sharing data:
Given the unprecedented public hunger for covid data, many countries set up (interactive web-based) dashboards, providing a wealth of information to their citizens.
Among large economies, there was one outlier that did not set up such a portal: India.
A better database could have been life-saving:
An authentic geo-tagged database would have given epidemiologists a better shot at predicting the evolution of the epidemic. The horrific second wave could perhaps have been averted.
2. Don’t use government data uncritically
Often bad news was suppressed by various state governments to show a picture of “All is well”. The trouble – the government officials began to believe their own hype:
Much of the ‘covid management’ protocol focused on imposing stringent conditions for recording covid deaths. State governments set up audit committees to certify covid deaths. Across several states, members of these panels faced pressure to whittle down death tolls, as data journalist Rukmini S. wrote in her book, Whole Numbers and Half Truths.
Yet, several government officials used these very numbers to argue that India’s covid mortality rate was much lower than its peers. At some point, they perhaps began believing their own hype.
What else explains the poor progress in ramping up health infrastructure and the slow pace of the vaccination programme till the second wave hit us in the spring of 2021?
3. We need an independent and credible statistical watchdog
There is always political pressure to dress up the numbers:
Given that the government itself generates the metrics by which its performance is judged, there is an inherent conflict of interest in the official statistical system. Any data that showcases the achievements of the government is trumpeted, the rest is liable to be tampered with
We need to invest in building an independent authority that is not liable to political pressure, taking the cue from other nations:
A well-regulated data ecosystem is very hard to build overnight. But countries that invest in such systems in normal years are able to reap the benefits during a crisis.
For instance, the UK’s statistics watchdog, the Office for Statistics Regulation (OSR), made several interventions throughout the pandemic to keep the data honest.The OSR reported a three-fold jump in case work in the April 2020-March 2021 period largely because of covid-related data complaints.
In one famous intervention, the OSR chief chided the British health minister for misleading the public on testing numbers.
The OSR chief chiding the Health Minister? Now that is a sign of true independence.
Hopefully, for the sake of India’s data quality – and quality of the subsequent decisions and impact on citizens’ lives – Pramit’s ideas are acted upon.
Podcast episode/s of the week
a. Tim Urban interviewed by Lex Fridman
I have a safe rule in consuming content – if it’s anything by Tim Urban, it is worth my time.
In this fascinating conversation, Tim gets into the thinking behind some of his greatest hits from the Wait But Why blog (posts like The Story of Us, Neuralink, The Elon Musk Series, Space X and Mars, Procrastination, The Tail End et al).
I was spellbound listening to some of the stuff about
– Mars: How will we colonise the planet? By when? How will we manage the administration? What will be the impact on Earth?
– Neuralink: Madness level futuristic stuff. Implantable devices with the ability to read thought, minute body signals, emotions and even suggest what we should eat/drink/do based on our physical and mental needs and constraints
– The Pencil (or iPhone 13) problem: A fascinating thought experiment (especially the iPhone one) which illustrates how much we take technology and specialised innovation for granted.
Tweet/s of the week
These panda videos are ADO-rable! Show them to your kids.
Quote of the week
“You can’t delegate thinking, Computers fail, checklists fail, everything can fail. But people can’t. We have to make decisions, and that includes deciding what deserves our attention. The key is forcing yourself to think. As long as you’re thinking, you are halfway home.”
– Airline pilot Richard de Crespigny, quoted in “Smarter, Faster, Better” by Charles Duhigg
Video of the week
a. Family Matters: Key and Peele (4:46)
I’m a fan of Key and Peele and this one features some brilliant frantic acting by the talented duo.
To understand the sketch, you need to know the context. There was a show called ‘Family Matters‘ which aired in the US in the 1990s about a middle-class African-American family. The show’s script was upended when a new character who entered in season 2 (a young kid called Steve Urkel) become a hit with the audience. The show’s writers began writing crazier and crazier scripts all centred around young Steve (while sidelining the main family).
The video is a hilarious imaginary conversation between the show’s lead actor and the producer about why that was happening.
Warning: A lot of foul language and violence in the clip!
That’s it folks: my recommended reads, listens and views for the week.
Take care and stay safe.


.JPG)