How to convey the human story behind the numbers

The missing element
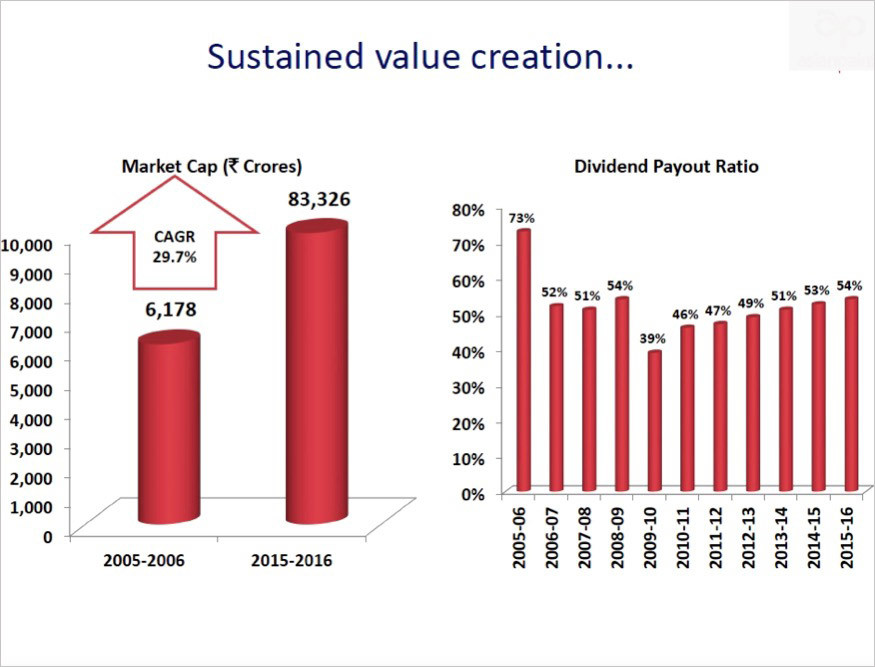
In a previous post, we had looked at presenting the market cap performance of a leading Indian company, using the right, clutter-free and appropriately-highlighted charts.
We had taken this slide
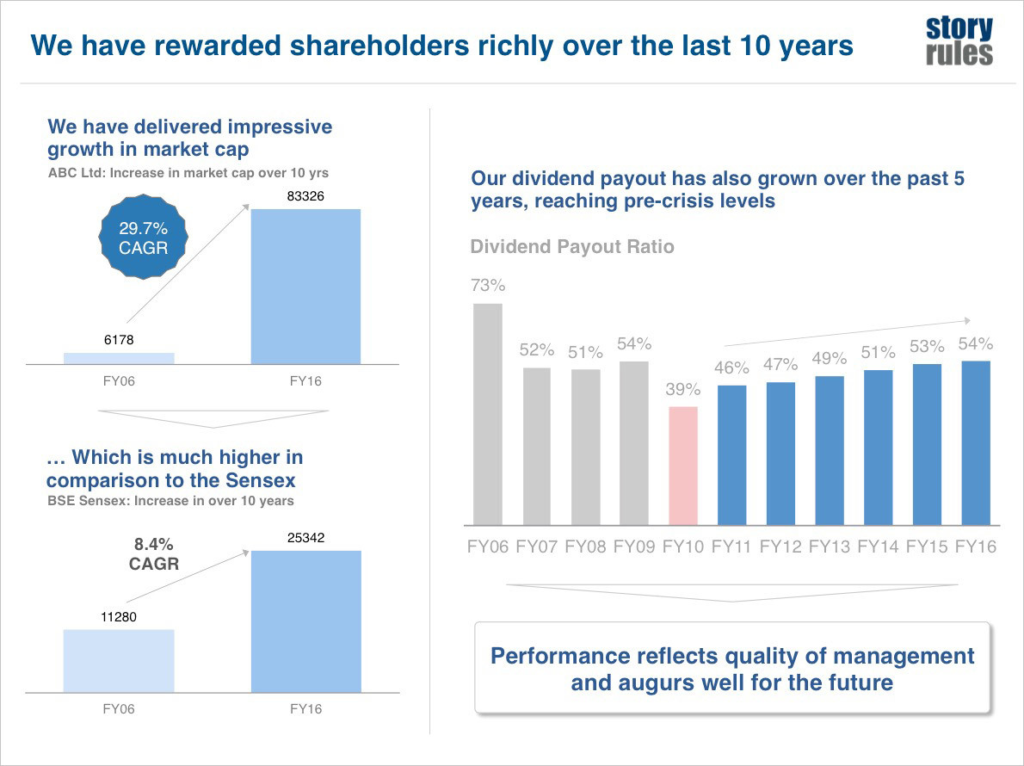
… and remade it as under:
At the end of the piece however, we had mentioned that it was missing something – the emotional element.
What is this “emotional element” and how can it make this slide better?
A larger audience setting
Imagine that instead of being presented in a small meeting or being sent through email, this presentation was going to be delivered to a large audience – say at the company’s AGM. Would you change anything on this slide?
Normally we end up using the same slide thinking – “it’s the same material, I just need to have some speaker notes, and I’ll explain it to them”.
Well, you can explain if there’s 3-4 people in the room. With an audience numbering (even) 20 or more, you’ll have a dual movie playing in their head: one of your words; and another of the visuals and text on the screen. People love to read if there’s something to be read on a screen; and soon their eyes (and a part of their brain) would be focused on one place on the screen, while the ears (and another part of the brain) will be valiantly trying to ‘get’ all that you’re saying. That’s sub-optimal; you want their full 100% attention if you want your message to stick.
Enter, the human story.
Finding the (emotional) human story behind the numbers
Given all that’s going for the remade slide, it is still a ‘cold’ one – focusing only on the numbers. What about the people?
Here’s a tip when you are trying to convey the ‘story’ underlying your numbers: look for the people. Try and ask the question: who is the individual, who is most likely to be impacted by, or has caused, these numbers?
So, if it’s a sales growth story, how about profiling the divisional sales head, whose unique scheme drove the bulk of the growth? If it is a story of job losses in a community, how about a single dad, who’s recently lost his job?
People don’t relate much to numbers or charts, people relate to people.
And so, if it is a story about superior market cap growth, who is most impacted by them? The shareholders of course. And among the thousands of shareholders, let’s try and find a representative person. Someone who’s invested in the company during that 10-year period – and preferably sold his or her holding towards the end of the period. And used that resultant wealth for a critical personal need.
How about this:

The remade slide just has one picture and a pithy statement. The idea is that the audience quickly glances at the slide, gets intrigued and is now exactly where you want them: all ears for your narration of the story.
Let’s say, you narrate it like this:
“Ladies and gentlemen, instead of telling you about our stock performance over the last 10 years, let me tell you the story of Mr. Nair. He had taken voluntary retirement in 2006 and had received a reasonable sum. He invested in a few mutual funds, and at the insistence of a friend, put Rs. 3 lakh in our company’s stock. (Smart friend.)
In 2016, Mr. Nair had an important event in his family – his second daughter’s wedding. Guess what came in handy for him? That 3 Lakh had grown to a handsome 40 lakhs in 10 years – and it was more than enough for him to meet the wedding expenses.
He had recently visited our Investor Relations office to share his gratitude… and you know what – seeing that contented smile on his face completely made our day.
Like Mr. Nair, there are thousands of other shareholders who have benefitted from our stellar performance. We’d love for you to continue to benefit from our success*. We have a rights issue coming up soon and we invite you to join in our future growth. You can pick up the forms on your way out of the hall“
Boom, your rights issue is over-subscribed several times.
An alternative, more powerful option to tell the story may be to get the person himself to the AGM and get him to narrate the story. Or perhaps a video recording in case he can’t make it, and you want to use it at multiple forums.
What did we do differently?
- Audience context is key: While the earlier chart-based slide was perfect for a small meeting of 4-5 participants, when you are delivering it in front of a large crowd, it won’t work. We need to ensure that the audience can relate to the data.
- Look for the human story: Once you have done your numbers, look for a good representative human story among the major trends. Three months after the presentation, people may not remember the data; but they will remember a good story.
- Beware of the ‘anecdotal evidence’ trap: A word of caution: some folks (read politicians) do the other way round. Irrespective of the overall data, they focus on an individual case which may not be representative of the entire data – and showcase it as the norm. Remember the adage: the plural of anecdote is not data. The data comes first – the anecdote/s are just supporting evidence, to make the data relatable.
- Keep the visual prominent, text minimum: If you are narrating an anecdote or a human example, the audience attention should be on you. Keep the slide simple with a large evocative visual and minimal text.
- End with a call to action (if available): Once you have convinced someone with a moving story, it is useful to have a clear call-to-action that can capitalise on the interest you just created.
So the next time you’re making a data presentation, ask yourself: can I narrate an interesting, representative human story underlying this data? You may find your own Mr. Nair.
* You may need to put in some disclaimer here on the lines of “past performance isn’t an indicator of future”, depending on the compliance requirements.
Photo by Etienne Girardet on Unsplash