E11: Brent Dykes – Author of seminal book on Data Storytelling
“I’m in the boardroom, he’s in the middle; (There are) Managers around, listening to my presentation; I get to the slide with this insight or observation that I had found, and he tilts his head, looks at it, and then blurts out “Bullshit!”
At that moment I was like, ‘Oh crap, I have just stepped in it. I am not going to be one of the MBA students hired now. I am in trouble here,’ and I was a little bit flustered.
I wasn’t expecting that reaction; I was expecting ‘Oh, that’s interesting, Brent! Tell us more.’ or maybe, ‘We should look into that.’ But nope, it was basically flatly denied, and luckily, I had a mentor who jumped in and gave me some cover fire.
I escaped the room that day relatively unscathed, maybe my ego (got) bruised a little…but what did die that day was that observation; that potential insight went nowhere. Nobody picked it up and said “Hey, let’s look at this trend!” or anything.
Basically, when the Senior VP says ‘bullshit!’ about something, I don’t think there’s another Manager who would pick it up. So, that taught me a very good lesson that I have to find a better way to approach communicating data.”
That is Brent Dykes, author of “Effective Data Storytelling: How to Drive Change with Data, Narrative and Visuals” a seminal book on the topic.
In 2016, Brent (who started his career in Marketing Analytics) wrote an article on Data Storytelling in Forbes magazine. That article went viral with 3-400K views. In subsequent conferences and talks, Brent was asked for book recommendations. He realised that there wasn’t anything which covered the stuff that he was talking about.. and he decided to write one himself.
I’m so glad he did, because I learnt a lot from his book. In a newsletter post a few months back, I’d written a review that was effusive in praise of the book. No wonder then, I was excited to have Brent in my podcast.
In this conversation, Brent shares some of his best insights from the book:
– Why do you need to tell a data story: to ensure that your hard-won insights are not ignored
– When do you need to tell a data story: The simple but effective concept of the Story Zone
– How do you tell a data story: the different types of narratives and the one that Brent prefers
– The idea of a Data Trailer as a way of enticing the audience to listen to the entire Data Story
In addition Brent also narrates some fabulous contrasting examples – of people who struggled to make an impact because of poor storytelling, as well as of folks who changed the world through the power of story.
As always, I’m sharing some some lightly-edited extracts from the conversation – tagged under ‘the 3Ps’ – the Personal, Philosophical and the Practical (all emphasis mine):
1. Personal:
a. Saving Insights – WHY do you need to tell a data story
At the beginning of this post, I shared the stressful office incident narrated by Brent, where he got yelled at by a senior leader for a finding that he had presented. I’m sure we’ve all had such instances where a powerful insight we have shared has been ignored or worse, ridiculed because the audience was not ready to accept it.
Here’s the entire incident as told by Brent:
Brent: “It goes back to when I was an MBA student, and I was working at a B2C company … they had a very renowned e-commerce team which I was a part of. And I was one of multiple MBA students that were all vying for a position at this company, and we had to present to the Senior VP of e-commerce, who wasn’t your typical executive. He came from a Special Forces background, he flew helicopters in the military, and had the typical military persona… he had a reputation for being very stern, (and he was obviously a) very sharp guy, very intimidating; it wasn’t unheard of for MBA students to come out of presentations with him with tears in their eyes. Anyway, it’s very intimidating and here I was — with a midpoint presentation to check on how we were doing with our projects.
And as I was preparing for this presentation, I stumbled across an insight in some customer feedback data that I had, and it showed that they didn’t feel as strongly about one of our core principles of our e-commerce… I think it was related to our shipping policy… And when I made this observation, I was like, ‘Oh, wow, this could be meaningful to the business. If our customers don’t feel as strongly about our shipping policy as we feel it should be, then maybe we should be focusing in other areas.’
Fast forward (to) two weeks later — I’m in the boardroom, he’s in the middle; (There are) Managers around, listening to my presentation; I get to the slide with this insight… and he tilts his head, looks at it, and then blurts out ‘Bullshit!’
At that moment I was like, ‘Oh crap, I have just stepped in it. I am not going to be one of the MBA students hired now. I am in trouble here,’ and I was a little bit flustered. I wasn’t expecting that reaction; I was expecting ‘Oh, that’s interesting, Brent! Tell us more.’ or maybe, ‘We should look into that.’ But nope, it was basically flatly denied, and luckily, I had a mentor who jumped in and gave me some cover fire. I escaped the room that day relatively unscathed, maybe my ego (got) bruised a little…but what did die that day was that observation; that potential insight went nowhere. Nobody picked it up and said ‘Hey, let’s look at this trend!’ or anything. Basically, when the Senior VP says ‘bullshit!’ about something, I don’t think there’s another Manager who would pick it up.
So, that taught me a very good lesson that I have to find a better way to approach communicating data. Did I fully support that observation? Did I present it, or communicate it, in the right way? I would say, no, I let it down. And partly, that has led me to my journey, or to the discovery of data storytelling and how we can take the combination of data, narrative, and visuals, and bring them together to really tell powerful data stories. And I really believe that it makes a big difference.
I’m sure lots of your listeners also work with data a lot (too), we make these observations, or we find these insights, and it can take a lot of work to just get to that point of finding an insight. (We have to get) all of the data, we have to capture all of the processing (and) preparation of that data, then the analysis. And then, in the final last few yards to get to the finish line, we stumble and we don’t communicate it effectively. So, that’s what I’m trying to address with data storytelling; I’m trying to say, ‘Let’s try and preserve some of these insights because they have value, that is just not being communicated clearly. People just don’t understand them, they can’t fully appreciate why they are valuable.'”
2. The Philosophical:
a. The Story Zone – WHEN do you need to tell a data story
In my teaching, I’d cover the ‘What’, ‘Why’ and ‘How’ of data storytelling, with most of the focus on the How.
But I’d missed a crucial question: the When.
Not every presentation situation requires a hard-to-create data story. Here’s Brent talking about the Story Zone.
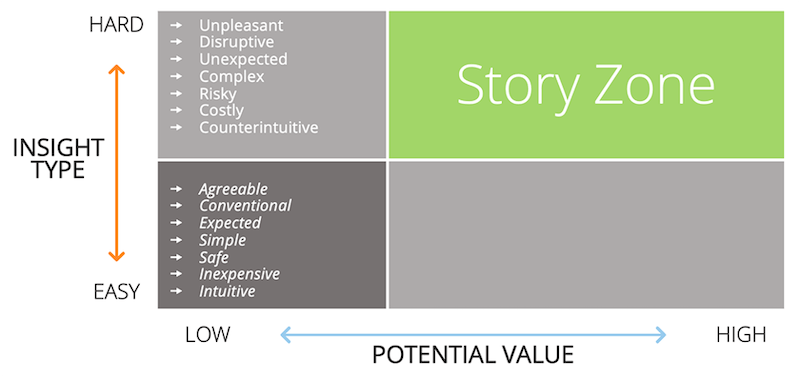
Brent: “So in my book, I call it the Story Zone, and basically there’s a typical consulting, four-by-four matrix… Along one axis you have the value of the insight, is it a high or a low value insight? That’s one determination. And then the other scale that I have is whether it’s a hard insight or an easy insight to process or understand. So, what do I mean by a hard insight? Well, if I’m coming with an insight that says that the program that we just launched six months ago has been a failure, and we need to stop it, and (suppose) you were the creator of that or (you were) the team that I’m presenting this to that have invested hours and money and all kinds of effort to do, that’s going to be a hard insight for you to swallow. Or, I come back with something that’s counterintuitive to the team. I could come back with an insight that’s going to be very costly. And so, in these situations, the status quo is always going to feel much easier to go with. It’s when we have to drive some kind of change and we know that there’s going to be either some emotional or other kind of resistance to that, in those situations where we have a hard insight to process or understand, and we also have high value – and I would say even medium value, that we would want to build a data story in those cases.
Now, let me give you an example of where you wouldn’t need to invest a lot of time in building a data story: what if I come back and said, ‘Hey, that campaign that you guys just rolled out or that new product launch that you guys just did, it was an amazing success! Let me walk you through how it was a success.’ And everybody’s going ‘Yeah, I knew it was going to be successful, you know, oh, pat on the back…’ Do I need to do that, the full data story? No, I don’t. I can just give them the facts and there’s no objections, it’s all just feeling good. Or maybe it’s low value, do I want to invest in an insight that’s hard, but at end of the day the payoff is very small? In that case it’s like, ‘meh.’ Sometimes when I do workshops and when I’m training people, I’ve had some data analysts come back to me and say, ‘Man, this data storytelling seems like a lot of work’, and it is! I will say it does require an investment of time, it’s not as easy as just building another dashboard, or just pulling together a report, and then just throwing it over the wall, and whether that report or that dashboard survives or not, or how it’s received, doesn’t matter. In this case, if you have an insight that is meaningful, that is maybe harder to process or to accept but we know it’s valuable, then we need to invest that extra time. And that’s what I try to convey to people that, ‘Don’t worry, you don’t have to create a data story for everything. But in those moments where it is required, and you’re going to run into some resistance, you’re going to run into some questioning or some doubts, that’s when you need a data story to help push people over the crest of the hill to actually take action, and to take the right action.’
b. Brent’s data story framework inspired by the Freytag Pyramid
Like I had written a few weeks back, there are several storytelling frameworks and all of them have one thing in common – they talk about how a problem was solved.
Brent has developed his own story framework based on the Freytag Pyramid:
Brent: “If we go back to the original Freytag model, it basically starts with the Exposition. With an introduction to the characters, setting the scene; And then there’s, I don’t think it was in Gustav Freytag’s model, but it’s a modification on his model, but we talked about having an Inciting Incident in the story; and I use Harry Potter a lot when I’m explaining this Freytag’s Pyramid, because we have this poor, orphan boy living a miserable life under the stairs, with his adoptive relatives who hate him, and mistreat them, and then one day they go to the zoo and he speaks to a snake. And that’s the inciting incident, that’s when he realizes, ‘Oh my gosh, there’s something going on. I’m not just a normal boy.’ And then we go through the next phase which is the Rising Action, where Harry Potter gets rescued and brought to Hogwarts, and then he gets assigned to a house, he does Quidditch, and then he battles Voldemort. And then, that’s the climax. And then after that, you have Falling Action. So, after that main battle scene, where we’ve learned that Dumbledore had defeated Voldemort… So, everything’s kind of resolved and then you have the resolution at the end.
Now, how do we approach that with data storytelling? That’s pretty similar, we start with what I call the ‘setting and hook’. And so, we’re introducing people to the data set that we’re looking at, what’s the status quo? How do the trends typically go? What are the expected results that we typically see? And then we have what I call ‘the hook’, which I also call a ‘hmm’ observation. It’s an observation that makes us go ‘Hmm, that’s interesting. Something’s going on with the data.’ Now we notice a spike in a particular metric that’s unexpected, or a drop in a metric, or something changes in the data that would catch our attention, and would catch the audience’s attention. That’s the hook that begins the story, so we provide just enough context to understand the hook, and then we go into what I call, instead of rising action, I call it ‘Rising Insight’. So, it’s like an onion and we start to peel that onion and dig into ‘Why did this happen?’, ‘Why did this metric spike?’ or ‘Why did this metric go down? What’s contributing to it?’ and we start to reveal to the audience what’s going on. And then, we build up to our ‘Aha!’ moment which is our big reveal, our big takeaway. And at the end of the day, if they don’t remember anything else, as long as they remember that ‘Aha!’ moment, then we’ve succeeded.”
b. Do we need a Chief Data Storyteller for the organisation?
This was an interesting aspect we discussed:
Ravi: “…You’ve said that… data literacy will be at different levels in the organization. Similarly data storytelling skills will also be at different levels in the organization; do you think there’s a role for some sort of data storytelling team, or a Chief Data Storyteller, so to speak. Who’s got a few folks working with him, and who basically goes around the company and helps identify these stories which need to be told, and then brings them out?”
Brent: “Yes and no. It comes from my analytics experience, because there’s two models for doing analytics, there’s the centralized team approach, where, basically, all of the other functional teams need to go through the analytics team to do any kind of deep analysis; Now, the challenge with that model is – I mean there’s benefits and there’s drawbacks – The one thing (about) having a centralized team (is that) they all work together, they’re very familiar, but the challenge is that they may not understand the business. They may not have the domain expertise, and they’re removed from where the action’s happening, essentially. So, the other model that I’ve seen in analytics that works really well, is the Hub and Spoke. You have a central team which is smaller, but then you have spokes, where you have dedicated analysts and each of the teams. And, because they’re in those teams they understand the business context, the business domain for that team, and the challenges they’re facing. And then, they’re able to apply the analytics to that.
So, a couple of questions come to mind: do we need to create yet another team? Maybe. But I would say that would be a short-term solution to get things moving. I would say, eventually, you would have to have those skills within the analytics team, or within the business teams, and then it’s just kind of there. So, I don’t have a problem with having a team set up to spearhead and get things moving, but I think (in the) long term, that these skills just need to be a part of how we work. It’s funny, if you think back to the when the web was first starting, we had a webmaster, how many webmasters are there today? Now there are none, because the Internet and the web has just been embraced by all different teams; and so, I think that, initially…because we’re just beginning, there might be a need for this and some dedicated data storytellers, or a dedicated data storytelling team. But I think long term, I don’t think that makes sense.”
3. The Practical
a. Try out a ‘Data Trailer’ if you aren’t sure of audience interest in the entire Data Story
Sometimes the audience doesn’t have the time for a detailed data story – where you may be unveiling the insights in an engaging way, but they aren’t sure if the end outcome would be worth their precious time. Which is where Brent has a suggestion: don’t keep them in suspense about the end outcome. Reveal it, upfront.
Brent: “Now, I’ve had pushback saying ‘Brent, I love the data storytelling arc that you just shared, but…’ (and) it goes back to our point before, where we have executives who say ‘just tell me the numbers’. And they’re programmed to operate that way. In some cases, there’s limited time, so they can’t spend a lot of time with each team that’s presenting them with information. So, the thing I came up with is a slight modification, I call it the ‘Data Trailer.’ The data trailer is a modification of the model to accommodate how a lot of executives look at their data today. Just to recap, you have your Setting, the hook, you have your Rising Insights, you have your ‘Aha!’ moment, and then you have your solution in the next steps. So, what we do for the data trailer is, we take the hook with just a little bit of context – it’s hard to present a hook without some context – and then we take the ‘Aha!’ moment. We don’t give them all the Rising Insights; we don’t give them the solution. We don’t talk about that, we just say, ‘Something’s going on here, and if we don’t fix it or if we stall, we’re going to miss this opportunity.’ and then we present it as a data trailer. It’s an abbreviated (version), and I would say it’s the worst movie trailer out there because you’re actually giving away the climax of the movie. But what it does, is if you get an executive who says, ‘Well, tell me more,’ because (they’ll be curious about) how you are connecting it. ‘Why are you saying we’re going to lose $2 million in the next quarter?’ Then now, you have permission to tell them the rest of the story. That’s my workaround for those scenarios where people may be sceptical. I don’t know if a data story will always work for my audience, if they’ll be receptive to it; In those cases, I’d say ‘Well, try a data trailer first’, and that could mean that maybe they say, ‘You know what? that’s interesting.’.
b. Adopting a curator’s mindset to collect good ideas
In the previous week’s newsletter, author Ron Friedman (of ‘Decoding Greatness) urges us to adopt a curator’s mindset. Keep a lookout for items that move you and collect them in a central place.
Here’s what Ron had written on the topic:
“The first step to achieving greatness is recognizing it in others. When you come across examples that move you, capture them in a way that allows you to revisit, study, and compare them to other items in your collection. When we think of collections, we tend to think of physical objects, like artwork, wine, or stamps. That definition is too limited. Copywriters collect headlines, designers collect logos, consultants collect presentation decks. Tour your collection as you would a private museum that you visit to find inspiration, study the greats, and remind yourself to think big.”
Brent Dykes collects, among other things, good quotes. I asked him his process for doing so.
Ravi: “the other element that I really loved reading in the book, is a very eclectic, or very thoughtful collection of quotes on stories and on data storytelling, by a very wide variety of people… So how would you actually (find these quotes?) Would you always have a lens over your eyes that (would suggest) ‘That quote is interesting’, or ‘Oh, that source is interesting’ and then you would put them into some sort of a folder in your laptop somewhere, or what were those tactical processes that you’d use?”
Brent: ” Yeah, with the quotes, I think, sometimes you’re just out in the wild and you read a quote and you’re just like, ‘Oh my gosh, that’s perfect. I love the angle of that.’ And I would say sometimes, when I started going down the path for the readers or for the audience, I have a lot of quotes in each section, I basically have quotes that introduce each one. And, it was a great idea when I started but then sometimes (I’d realize) ‘I don’t have a quote for this one’, and so then I would have to go out and find a quote (to use). I had a Word document that I kept and whenever I find good quotes, I would keep them (in that) and I continue to do that today. I would collect everything that I had, so I definitely had a great library of quotes.”
Sometimes it’s not about the fancy tool – Evernote, Notion, Roam – you use to record your notes. A simple Word document can also do the job, if you do it diligently and refer to it often.
And those were some highlights from the conversation with Brent Dykes, author, speaker and storytelling coach.
A few things which stayed with me:
1. The Story Zone: Not everything needs to be told as a Data Story
2. The use of different story narratives and data trailers based on requirement
2. The contrasting stories of Dr. Semmelweiss vs. Florence Nightingale and Dr. John Snow – which indicate the criticality of this skill
3. The need to ensure that you have Relevant, Comprehensive and Credible data – and to double check your hypotheses.
You can enjoy my conversation with Brent at your favourite podcast location:
Browser
Podcast apps: Apple Podcasts | Spotify | Google Podcasts | Stitcher | Podcast Addict | Pocket Casts
Happy listening!
If you find the content valuable, please rate and review this podcast on iTunes, Spotify, Google Podcasts, or wherever you listen to them (links above). It’ll help others like you discover these insights!
This podcast was hosted by me, Ravishankar Iyer. Audio editing by Kartik Rajan. Transcript editing by Amisha Jha and all-round support by Sanket Aalegaonkar.
Thanks,
Ravi