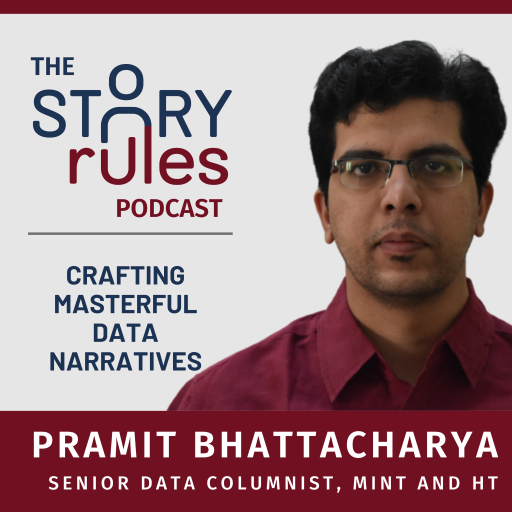
E15: Crafting Data Narratives with Pramit Bhattacharya
I’m excited to release the next episode of the podcast with Pramit Bhattacharya.
Pramit is the ex-Data Editor at Mint and currently a freelance data columnist based in Chennai. He writes the ‘Truth, Lies, and Statistics‘ column for Mint, and ‘Simply Economics‘ column for the Hindustan Times.
Data is the core raw material with which we build a story.
If the quality of your sand or clay is rubbish, then the bricks, and the house that you build with it, will also be rubbish.
Pramit has spent several years tracking macro data in India – from various government and institutional sources. He deeply understands the storied history of India’s statistical infrastructure as well as some of the recent troubling developments in that space.
Over the years, he has written several detailed pieces arguing for what needs to be done to improve our data foundation.
He has also written data-driven investigative pieces which have shed more light on key sectors of the economy.
In this conversation, Pramit shares some of the techniques that we can all use when working with data:
1. The importance of validating your data.
– How do you know what data sources (especially from the government) to trust?
– How the use of transparency – especially concerning the raw-data and collection methodology – can engender trust in data?
– And how you can check the credibility of one metric by triangulating data from other related sources?
2. Hypotheses vs bias: Pramit also shares the technique he uses to avoid getting swayed by his own hypotheses and biases when he’s investigating a data story.
3. Counterfactuals: Finally, he talks about the importance of the counterfactual – a key technique to ensure that we don’t get too influenced by alarmist headlines. By asking ourselves – ‘Ok, X looks bad, but what is the counterfactual? What is the norm for a similar context?’ – we can be better placed to come to an informed judgement about X.
It’s a conversation filled with practical nuggets of wisdom that you can use to improve your own data stories.
Unfortunately, we had to cut this conversation a bit short because of an unforeseen commitment that he had. I definitely hope to continue my conversation with Pramit sometime in the future!
With that, let’s dive in.
As always, I’m sharing some some lightly-edited extracts from the conversation – tagged under ‘the 3Ps’ – the Personal, Philosophical and the Practical (all emphasis mine):
1. Personal:
a. What matters is not just where you are born, but also when you are born among your siblings 🙂
Pramit is the younger sibling and that is perhaps one reason why he’s doing what is he doing:
Pramit: I feel I had a strong rebellious streak, since childhood. Which has come down over time; I have mellowed now. When I started off, the people around me were preparing for engineering and medical (degrees), as was usual in most middle-class places. The place I come from – Tezpur, in Assam – is known as a cultural centre, as well as a sort of educational centre, in Assam. So, who got high ranks or marks in the state (was a topic that) would be discussed within town for several days; My brother, for instance, stood 9th in class 12th and people remembered that for years. There, the usual choices were engineering and medical. Somehow, I felt that I’m not going to do that.
Ravi: What do you think was the source of that rebellious streak?
Pramit: Maybe an authoritarian father? My father was a maths teacher, and quite strict. That could have provoked. Other than that, it’s really hard to (pinpoint a cause).
Ravi: You’re the younger one, you said?
Pramit: I am the younger one, yes.
Ravi: Maybe you didn’t get as much pressure as your elder sibling.
Pramit: Yeah, definitely. The other thing was that (in people’s families,) everyone’s desire was to get into IIT. But in my family, the desire was to get into ISI. Once my brother cracked that, he went to ISI and studied there for 5 years. Then he took the pressure off me. That’s why my life became what it was. Otherwise, I think I would have spent far more hours studying maths and preparing for that, and so on.
Ravi: Fascinating, right? These accidents of when you’re born, and not just where you’re born in the family also have some sort of an impact (on your life).
2. The Philosophical:
a. Data does matter – especially for the massive middle
Does data really matter in today’s post-truth age?
Ravi: In today’s times of so much misinformation and preconceived notions, camps, etc., do you still believe in the power of changing people’s minds with the right data? Or are you now a little skeptical, like “It doesn’t really matter, Ravi. There’s too many cross narratives going on, and the data doesn’t really help too much.”
Pramit: I think I still believe in it. With the caveat that we should not expect revolutionary things. Data is not going to bring about a revolution, and we should be skeptical of anyone who says that anything can bring about a revolution. At the margin – does it make a difference? I think so. There will always be people who have pre-decided what ideology they’re going to support, economics, politics, etc. There’s very little you can do about that. But there is also a very large middle ground of thinking people, smart leaders, smart organizers, who do not have a pre-decided mindset on most things. And it is to them, largely, that you talk with. You have to convince and persuade them, but to do that you have to first convince yourself. Data plays a huge role in that, “I have to be convinced of my story first. Then, I can convince the other person.” In both these processes, data plays (a role).
Ravi: I really like the point that you made about the massive middle. Unfortunately, what happens is that the people at the margins disproportionately own the airwaves, so they make a lot more noise, and you have a sense or feeling that everybody is either here or there. But a lot of people who are there in the middle are silent. They’re the silent majority. It’s always good to remind yourself that it is making a difference; it’s not being seen, but you should continue to work.
b. Think in counter-factuals
Ravi: One technique that you had used in another conversation comes to mind, which is the technique of a counter-factual. Essentially, the context to this was that you were talking about India versus China, which is a very classic one, and about the North-east and the various challenges that have happened there – the independence movements, all the violence, etc., and one interesting counter-factual that you had talked about was that a lot of people did want independence for (some parts of) the North East post 1947, but what you say there is that (independence) is possibly never going to happen, because if it was not India, (the North East) would have been under China. And that’s a great, useful counter-factual to have, and you end that part of the conversation by saying, “If that would have been the case, I wouldn’t have been having this conversation, because you can’t have this conversation in China.”
I really loved that, because when we have a certain situation we think, “Oh, this is bad! This is terrible!” but we never ask ourselves, “what is the counter-factual here? If this is bad, couldn’t things have been worse?”
Especially when you look at a country like India, where you know this is bad… We don’t have literacy, we don’t have this, we don’t have that, do you sometimes consider saying, “What are the counter-factuals?” What are some right comparisons for India as a whole to say that we are actually not doing too bad here, given our situation, given that we just got independence in 1940s; and these are the areas where we are actually struggling, even though we had so much time. Do you think about that?
Pramit: Yeah, all the time. In fact, in recent years, I have come to the view that India’s developmental journey since it won independence has not been that bad. I did not have this view, maybe even five years ago. But now when I look at it, the range of things we have – right from the freedom to write, freedom to vote, freedom to speak our mind, to the choices that we have when we go out to the market; the sheer range of things that we can do, the things we can take part in, the kind of activism we can do, the kind of jobs we can do, the many languages that we are exposed to and can pick up if we have an inclination for (it); I think we are too critical – even I am too critical of many things, sometimes, and it reflects in my writing – and we underestimate (the country) because we don’t use the right counter-factual. You are absolutely right.
3. The Practical
a. Techniques to validate data
Pramit shares several techniques to validate data from public and private sources.
i. Go to the source
Pramit had made this point in another podcast:
Ravi: One interesting and simple point that you make is: go to the original source. If there is some Niti Ayog report that says “this data is from World Bank”, do not trust that the data is from World Bank. Go to the original World Bank report, make sure they actually have it there, and if that is reporting from somewhere else then go to that original source.
ii. Hierarchy of reliability: Independent government department data > Other Government data > Private Data
Ravi: If I’m a user from a large corporation, or from an economist think tank, etc., what would be the hierarchy of data sources?
Pramit: Let me talk about it in the way that we get data or see data. A lot of our emails get flooded with random – no, not random surveys, arbit surveys, done by various organizations, because random is a statistical term and surveys should actually be randomized. But these aren’t randomized, these are surveys of 100 people done at some mall, or done online without any proper methodology. Most of those surveys that you encounter, especially in the private sector, are bullshit surveys. There is no other way to describe it. Within the private sector, I would still say, despite my reservation around CMIE’s Consumer Pyramid survey, that they still do a better job than many other household services. There’s CMIE and another organization called PRICE, which does an ICE 360 survey on consumer markets and so on. They have a fairly large sample; they have a certain methodology. I still think both of those surveys have an urban bias. I have not looked at CMIE very closely, but to the extent I have (this is what I think.) I have looked at PRICE very closely, and while using PRICE results, I always caution readers that the rural findings should be taken with a pinch of salt.
Then you move onto the next step of government data. Which are usually more trustworthy than any private source. Within that there is, of course, a hierarchy. To figure out the hierarchy, you need to ask who is the data producer? What are the incentives facing that data producer? What are the quality checks institutionalized by that data producer or whoever is in charge?
Think of something like a census: it happens every 10 years; The Registrar General of India – there’s a constitutionally mandated system of how it will be done, laid down during the founding moment of the constitution itself. There is a very clear structure out there; after every census they do a post enumeration survey to cross-check their findings. Before every census, there is a months-long training program where they train the enumerators who actually go out into the field. All of this is very publicly published; you get the details, and much of the detailed census data is available online. There is a fairly strong level of transparency, although we could do with more, we could always debate (over that). But it is my opinion that the census has some steps still to be taken to facilitate data transparency. The point is, (a) They have a long history of producing credible data, they have a process and everything; and (b), they do not have any particular incentive to tilt the data in a particular direction.
The Registrar General of India is not responsible for, say, meeting sanitation targets, or meeting (the targets for) how many schools or hospitals should be built – which is what you evaluate governments on. The data on toilets that the 2022 or 2023 census will throw up will be much more credible than the data from the dashboard that the sanitation ministry is going to throw up, because the sanitation ministry has an incentive to say that we are working really hard. It has nothing to do with this government or that government, it happens in every government.
iii. Don’t be overly dependent on a single metric; triangulate and examine it in the context of related metrics
In the recent Economic Survey, there was a lot of coverage given to apparent progress seen through satellite based night lights data. Pramit had written a cautionary article about the same.
In podcast I asked him to elaborate on that aspect:
Ravi: A couple of other things that you have written about, in terms of just testing the validity of a data set, is don’t rely on data from just one source. Howsoever “sexy” that source might be, and this recent instance that you talk about is the Economic Survey and the night lights data, which became a huge talking point … about how in North India, especially UP and Bihar, when they compared satellite data on nightlights, they found far more areas of illumination in UP and Bihar in 2012 vs ‘21… There’s a lot of allure (to say) that, “There’s this one source that’s really supporting the point I want to make, so let me run with it,” but no.
So, triangulation – looking at multiple data points, maybe you can talk about how one can do that. Maybe you can talk about this specific incident, and in general, how is it that you can cross-check or verify data from one source with other related but different sources?
Pramit: Yes. I’ve written this recently. I’m not questioning the use of new sources of evidence, I myself have used many new sources which people, previously, did not use for those purposes, and it’s absolutely fine. It’s just that you have to be careful in doing it. So even if you want to use satellite images, A – you have to be careful; B – you have to tell the user what the steps you took in being careful are. Don’t assume they’ll trust you on your word.
In this case, the first problem was that there was no transparency. And this was a public document. A team of government officials spent months in preparing the economic survey. It’s ultimately our money, taxpayer money, which is funding this. So, the least they can do is clearly tell us what they have done. They did not do that. There is no legend in that map, if you look at the document; basic details were missing. And then when you get that raw satellite data in pixelated form, it doesn’t come in the form of maps. Someone will have to process it, make certain assumptions; even simple things like cloud cover – different parts of India will have different cloud covers at different points. For instance, the monsoon season in South India functions differently from the rest of the country. Even now in Chennai, it’s the fag end of a second monsoon, which is not there in other parts of the country. So, it’s cloudy today.
So, how do you adjust for those things? You need to make certain assumptions. You do it over a period of time, of course; you take rolling data, and so on. You will have (different data) for the same city on different days, with clouds and without clouds, and then you will do some adjustments. Then there is the question of threshold: in the map, it is shown either as lighted or dark; there is no in-between, it is very hard to show the in-between. But in reality, much of urban and rural India is in-between. If you take too low a threshold, then it is the areas which are least developed that will also come in as very lighted. All of these parameters and adjustments need to be made, of course, but need to be communicated as well. That is very important.
No data exists on its own; there has to be a story, or a theory, or a hypothesis which connects that and everything else that we know about the world or the subject matter of your story. When you say that these two states in northern India have developed, is it reflected in the GDP per capita numbers? Is it reflected in the unemployment numbers, that government data itself is collecting? Is it reflected in the other development indicators? For which there are multiple surveys that they could do. So, some kind of comparative analysis (is needed), and that, I think, is useful in any number of fields.
When we were students of the Indian economy, a professor told us that if one particular variable or metric is pointing in one direction, and nine others are pointing in another direction, then be very, very careful of that one metric. The idea is to look at a range of metrics that’s as far broad as possible, and to some extent, (all surveyors) are already doing that, it’s just that they don’t apply it everywhere. For instance, in the economic survey itself, they showed how they are looking at a dashboard of high-frequency indicators to monitor monthly (growth), and that’s a good thing. They should not be looking at one indicator.
And those were the highlights of my conversation with Pramit Bhattacharya, leading data journalist and an expert on India’s statistical architecture.
A few things which stood out for me in the conversation:
– The need to be smart about trusting the source of data
– The need to write down your hypotheses/biases so that you are aware of them when you begin the research
– The importance of thinking in counter-factuals
You can enjoy my conversation with Pramit at your favourite podcast location:
Browser
Podcast apps: Apple Podcasts | Spotify | Google Podcasts | Stitcher | Podcast Addict | Pocket Casts
Happy listening!
If you find the content valuable, please rate and review this podcast on iTunes, Spotify, Google Podcasts, or wherever you listen to them (links above). It’ll help others like you discover these insights!
This podcast was hosted by me, Ravishankar Iyer. Audio editing by Kartik Rajan. Transcript editing by Amisha Jha and all-round support by Sanket Aalegaonkar.
Thanks,
Ravi
